...
Physical Network Topology for testing
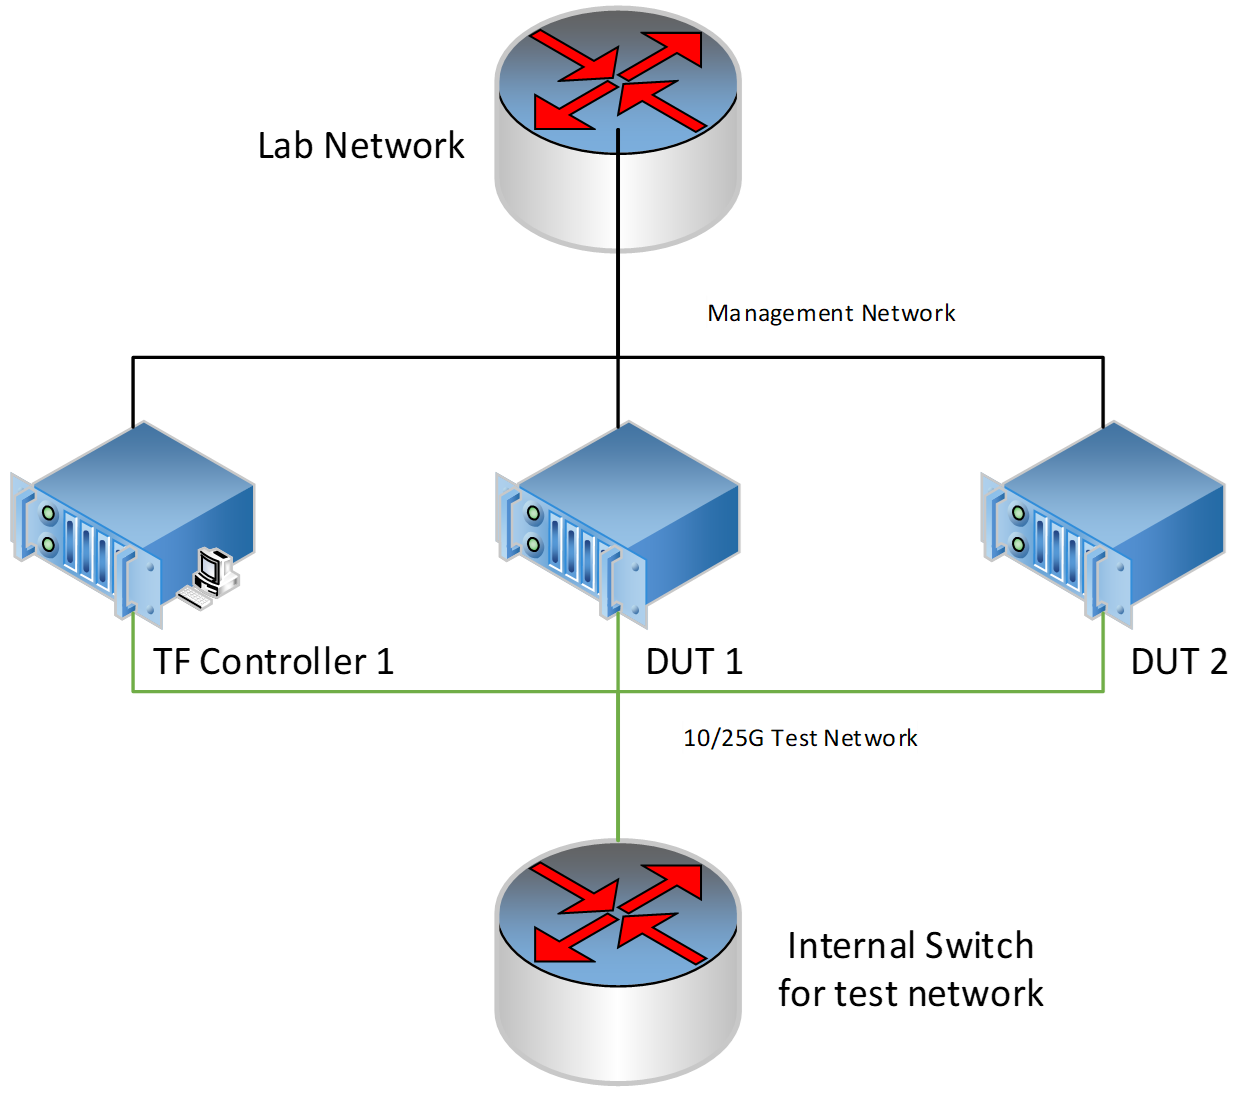
Generally, the physical topology has 2 networks, 1 network is for management and the other network is for test.
...
After deployment successful, the topology of network and services looks like,
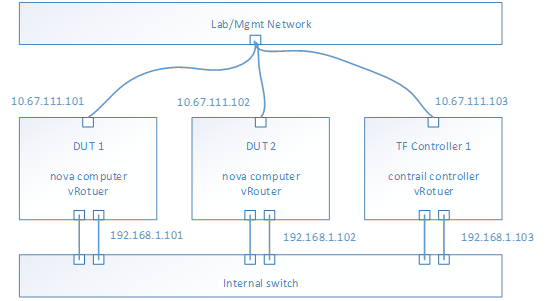
- E.g. Management Network is 10.67.111.0/24
- E.g. Test network is 192.168.1.0/24
- To check the test network by ping each IP address from each host
- Nova computer service should be running on each DUT host
- vRouter service should be running on each host
- Contrail controller services should be running on TF Controller host
- From TF 5.0, all the services are isolated into docker containers
- Use docker ps to check each service (kolla/openstack and contrail) running status
- Use contrail-status to check the contrail services healthy
- Optional, if you want to test bond driver, configure the bond device in the host OS and modify the physical interface field to bond device in instances.yaml.
...
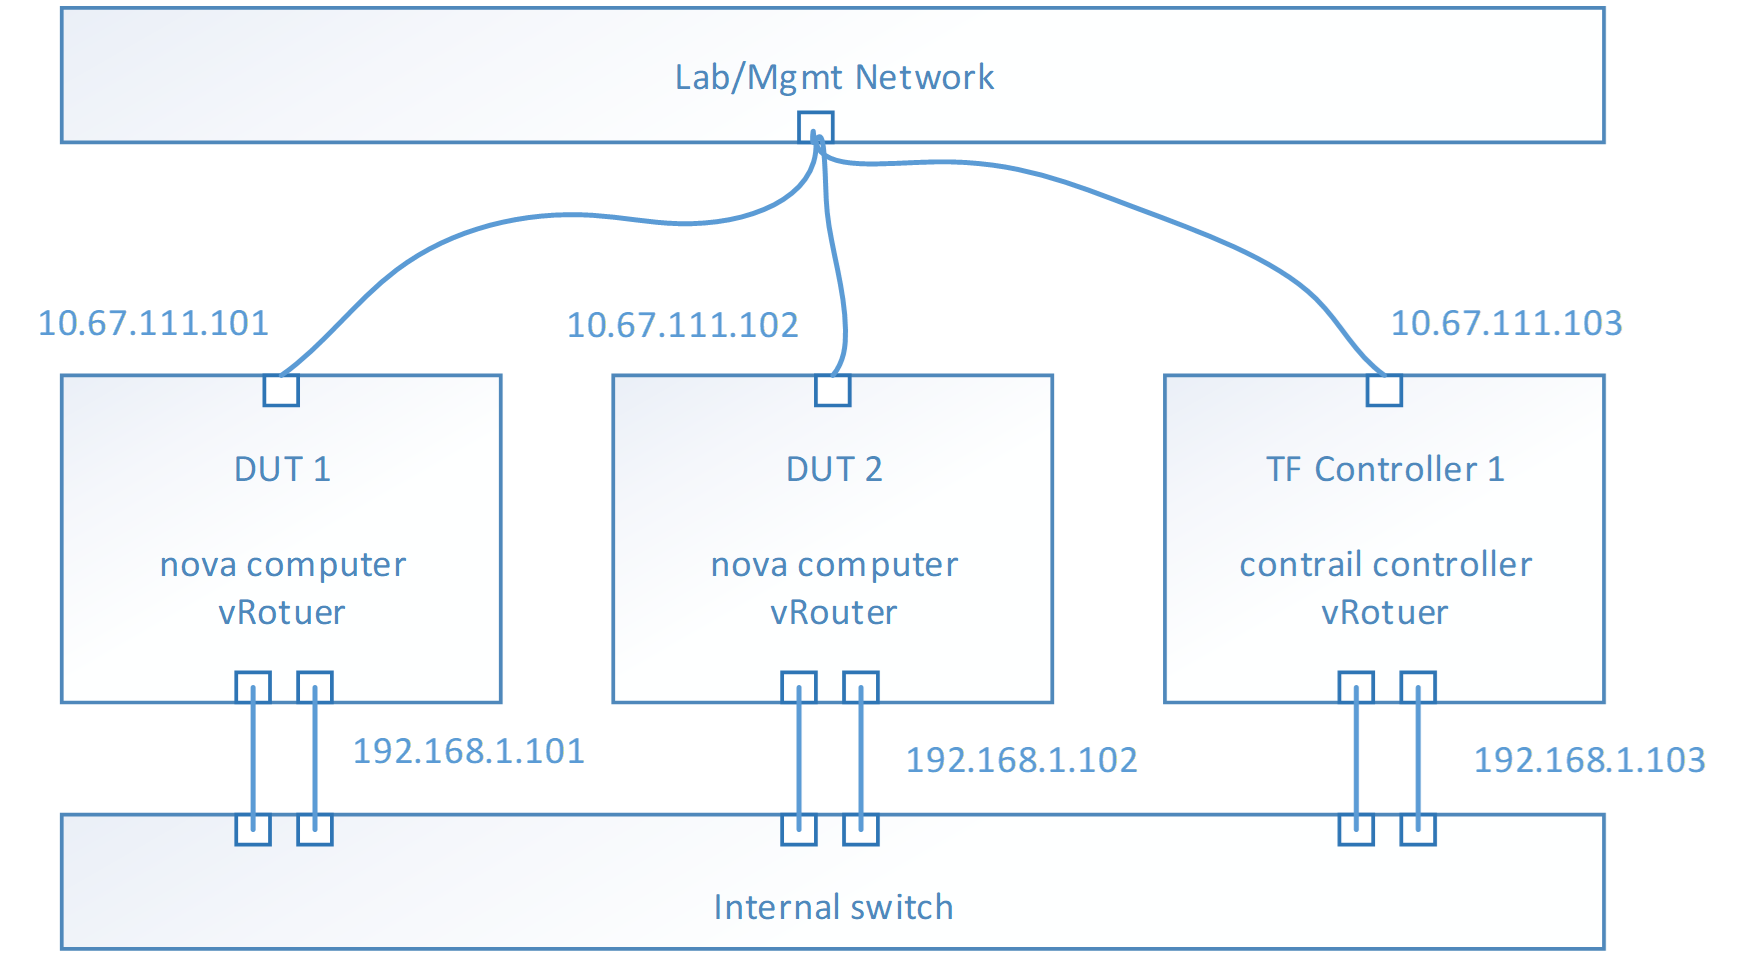
With the instances launched, the topology look like,
Performance tool - Trex
For VPPV test, Trex is used for traffic generator. So installing the trex to the instance is mandatory. Trex installation document at https://trex-tgn.cisco.com/trex/doc/trex_manual.html#_download_and_installation. Please follow up the guide to setup the trex into /opt.
...
As a reference we give an example on flow-table sizing for a given platform configuration. For example, for the following Skylake platform configuration:
- 1st Level Cache (L1) is 32KB (equivalent to 512 cache line), 2nd Level Cache (L2) is 1MB (equivalent to 16K cache line) and Last Level Cache (LLC) is 322MB (equivalent to 512K cache lines)
- If we assume an IPv4/IPv6 vRouter flow-table, then the entry size is aligned to 2 cache lines
- A small-sized flow-table should be initialized to hold a maximum of 8K entries to fit in local cache (L2). A medium-sized flow-table should be initialized to hold a maximum of 256K entries to fit in Last Level Cache (LLC). A large-sized flow-table should be initialized to hold significantly more than 256K entries to test the case when the table doesn’t fit in cache, hence, a table initialized for 1M entries covers this case.
- For each table size, the table load (i.e. the number of used entries out of total available) will reflect one test case. For example, for a medium sized table of 256K entries, the performance metrics (i.e. lookup rate, insert rate and table utilization) are measured for the case when user inserts 12K entries for the case of an almost-empty flow table, and 128K entries for the half-full case, and 230K entries for the almost-full case. Table -2 summarizes these 9 testing scenarios for the example platform.
Platform | Skylake Platform: L1 (32KB), L2 (1MB) and LLC (322MB) | ||||||||
Creation size for Flow-Table | Small: 8K entries (or less) | Medium: 256K entries (or less)
| Large: 1M entries (LLC holds up to 256K, so 4X of 256K entries does not fit in cache) | ||||||
Table Load (i.e. Flow Count) | Almost empty: 400 entries | Half full: 4K entries | Almost full: 7.5K entries | Almost empty: 12K entries | Half full: 128K entries | Almost full: 230K entries | Almost empty: 50K entries | Half full: 500K entries | Almost full: 950K entries |
Table 2: Example Flow-table Scalability Sizing
Test Case 1 – VPPV (VM to Phy to Phy to VM) throughput test
Summary
This test case is aim to measure the throughput of whole data path between the 2 VMs on different host. It’s close to PVP(North-South) test case, but it depends on a software traffic generator running in a VM. The traffics are from 1 VM to other VM, and lookbacked by a pathced testpmd. Measure the throughput on the same port in the traffic generator. 4 ports will be used in performance test. Test case will do binary search for getting the throughput under a specific packet loss. It’s limited by software solution, the packet loss is not accurate, so do not set the packet loss less than 1%. Default value is 1%.
Topology
- Run Trex in VM1 and testpmd VM2
- Trex server configuration file, e.g.
### Config file generated by dpdk_setup_ports.py ###
- port_limit: 4 version: 2 interfaces: ['00:03.0', '00:04.0', '00:06.0', '00:07.0'] port_bandwidth_gb: 10 port_info: - dest_mac: 00:00:00:00:01:01 # MAC OF LOOPBACK TO IT'S DUAL INTERFACE src_mac: 00:00:00:00:01:00 - dest_mac: 00:00:00:00:01:00 # MAC OF LOOPBACK TO IT'S DUAL INTERFACE src_mac: 00:00:00:00:01:01 - dest_mac: 00:00:00:00:01:01 # MAC OF LOOPBACK TO IT'S DUAL INTERFACE src_mac: 00:00:00:00:01:00 - dest_mac: 00:00:00:00:01:00 # MAC OF LOOPBACK TO IT'S DUAL INTERFACE src_mac: 00:00:00:00:01:01 limit_memory: 1024 platform: master_thread_id: 0 latency_thread_id: 1 dual_if: - socket: 0 threads: [2] - socket: 0 threads: [3] c: 1 |
Use this command to check the BDF number of virtio ports
# lspci|grep Eth |
- The testpmd is patched for swapping the both MAC and IP.
diff --git a/app/test-pmd/macswap.c b/app/test-pmd/macswap.c index 3a09351..f90ac18 100644 --- a/app/test-pmd/macswap.c +++ b/app/test-pmd/macswap.c @@ -80,7 +80,9 @@ pkt_burst_mac_swap(struct fwd_stream *fs) struct rte_port *txp; struct rte_mbuf *mb; struct ether_hdr *eth_hdr; + struct ipv4_hdr *ipv4_hdr; struct ether_addr addr; + uint32_t ipv4_addr_tmp; uint16_t nb_rx; uint16_t nb_tx; uint16_t i; @@ -127,6 +129,11 @@ pkt_burst_mac_swap(struct fwd_stream *fs) ether_addr_copy(ð_hdr->s_addr, ð_hdr->d_addr); ether_addr_copy(&addr, ð_hdr->s_addr);
+ ipv4_hdr = (struct ipv4_hdr *)(eth_hdr + 1); + ipv4_addr_tmp = ipv4_hdr->src_addr; + ipv4_hdr->src_addr = ipv4_hdr->dst_addr; + ipv4_hdr->dst_addr = ipv4_addr_tmp; + mb->ol_flags = ol_flags; mb->l2_len = sizeof(struct ether_hdr); mb->l3_len = sizeof(struct ipv4_hdr); |
Launch testpmd command line, e.g.
modprobe uio insmod dpdk.org/x86_64-native-linuxapp-gcc/kmod/igb_uio.ko ifconfig ens3 down ./dpdk.org/usertools/dpdk-devbind.py --bind=igb_uio 00:03.0 ifconfig ens4 down ./dpdk.org/usertools/dpdk-devbind.py --bind=igb_uio 00:04.0 ifconfig ens5 down ./dpdk.org/usertools/dpdk-devbind.py --bind=igb_uio 00:05.0 ifconfig ens6 down ./dpdk.org/usertools/dpdk-devbind.py --bind=igb_uio 00:06.0
echo 2048 > /sys/kernel/mm/hugepages/hugepages-2048kB/nr_hugepages cd dpdk.org ./x86_64-native-linuxapp-gcc/app/testpmd -l 0,1,2,3 --socket-mem 2048,0 -w 00:03.0 -w 00:04.0 -w 00:05.0 -w 00:06.0 -- -a --forward-mode=macswap --port-topology=loop --nb-cores=2 --txd=1024 --rxd=1024 |
Flow Configuration
Test case will trigger traffic on 4 paired ports, for example, P1 and P5 is paired, P2 and P6, P3 and P7, P4 and P8. Paired ports means the traffic will specify the source and dest mac, ip of the 2 ports. Between 2 paired ports, the data path workflow looks like,

- 4 groups of paired ports are used in testing
- Flow number depends on number of inner packet’s UDP sport, default value is 1k flows by change sport number from 10000 to 10999
Configure vRouter core number, if vRouter-dpdk is used
For vRouter-dpdk, cores are assigned for vRouter for polling threads. Change the configuration file /etc/contrail/common_vrouter.env to specify which cores and how many cores will be used by vRouter.
# Core mask field CPU_CORE_MASK=10-17 |
Then stop the vRotuer container and start again
/etc/contrail/vrouter# docker-compose down /etc/contrail/vrouter# docker-compose up -d |
Core Affinity
Core affinity is important for getting a maximum and stable performance number. Rather than pin the cores for vRouter-dpdk, for trex and testpmd in VM1 and VM2, we also need to pin the threads to the physical core by following commands
# Get the qemu pid ps -ef|grep qemu
# Pstree for its inner threads pstree -p 68274 (this is the ppid of the qemu thread, could be get by ps) qemu-kvm(68274)─┬─{qemu-kvm}(68279) ├─{qemu-kvm}(68375) ├─{qemu-kvm}(68376) ├─{qemu-kvm}(68377) ├─{qemu-kvm}(68378) └─{qemu-kvm}(68380)
# basically, the successive pid numbers are the different threads in VM, like 68375-68378 # so, pin these threads to different physical cpu cores for getting max performance
taskset -pc 5 68375 taskset -pc 6 68376 …
|
Test Specification
The VPPV throughput test is automated by a python script, it will do binary searching to find out the throughput under a specified packet loss. Follow these steps to run the test
a) Prepare the configuration file for the python script, test.py. Important, you need set the src/dst MAC and IP. Here is an example.
{ # this is the trex server address, generally, run the script on the same machine of trex server "server": "127.0.0.1", "ports": [0,1,2,3], "peers": {"0":0, "1":1, "2":2, "3":3}, #Since it’s a loopback test, so the peer port is itself "action": "NDR", "streams": [{ "port": 0, "stream": [{ "ether": {"dst":"02:6f:42:95:7e:42", "src":"02:11:cb:6c:44:e5"}, "ipv4": {"dst":"1.1.1.4", "src":"1.1.1.3"}, "payload": "g", "frame_size": 64, #change the frame size for "rate": { "type": "pps", "value": 9000 }, "flows":1000 }] }, { "port": 1, "stream": [{ "ether": {"dst":"02:38:da:2a:0e:92", "src":"02:60:a8:21:2e:5f"}, "ipv4": {"dst":"2.2.2.4", "src":"2.2.2.3"}, "payload": "g", "frame_size": 64, "rate": { "type": "pps", "value": 9000 }, "flows":1000 }] }, { "port": 2, "stream": [{ "ether": {"dst":"02:e0:c2:b6:37:ed", "src":"02:39:5e:ef:02:96"}, "ipv4": {"dst":"3.3.3.4", "src":"3.3.3.3"}, "payload": "g", "frame_size": 64, "rate": { "type": "pps", "value": 9000 }, "flows":1000 }] }, { "port": 3, "stream": [{ "ether": {"dst":"02:bf:cf:66:5e:fc", "src":"02:60:36:4b:17:0f"}, "ipv4": {"dst":"4.4.4.4", "src":"4.4.4.3"}, "payload": "g", "frame_size": 64, "rate": { "type": "pps", "value": 9000 }, "flows":1000 }] }], "duration": 25, "warmup": 5 } |
b) Launch Trex Server in VM1
./t-rex-64 -i --cfg trex_cfg_virtio.yaml #the configuration file is explained in Trex section |
c) Launch testpmd in VM2, for the command lines, refer to testpmd section
d) Run the test.py script with configuration file (json file)
Python test.py --cfg in_64.json |
e) The script will do several searching, eventually, the throughput will output at last line.
Note, if you consider the TX+RX performance number, in this test case, we need to 2 times the throughput number.
Test Scaling
For getting an overall of picture of the performance of Tungsten Fabric, considering to scaling the test case on several directions
Variable | Options |
Cores for vRouter-dpdk | 4, 8, 16 |
Hyper-thread enable | Y, N |
Inner Packet Size | 64, 128, 256, 512, 1024, 1280 |
Tunnel Type | MPLSoGRE, MPLSoUDP, VXLAN |
Flow numbers | 1k, 512k, 2m |
Packet loss | 1% |
|
|
Test Report
Test Case 2 – iPerf TCP throughput test
Summary
For iperf test case, the environment configuration is same to Test Case 1. But just use 1 group of paired port. The flow data path is

Test Specification
a) Launch the iperf server on the VM2
iperf -s |
b) Launch the iperf client on the VM1
iperf –c 1.1.1.3 –P 16 –t 30 |