performance_test_suite_v1.docx
Purpose
This document is target to define a performance test suite for Tungsten Fabric. A unified and simplified performance test solution/methodology benefits to users for
- Quickly measure the Tungsten Fabric performance by simply environment without and hardware tools/instruments dependency
- Use this test suite as a performance unified checking tool, if you do some performance optimization
- Align the performance checking methodology between developers and maintainers, for patch merging criteria
General
Hardware requirements
1x Intel Xeon server as TF Controller 1
- E.g. Intel® Xeon® Processor E5-2699 v4 +
- 256GB RAM
- 1TB HDD
- 10G/25G/40G Network Interface Controller on NUMA 0
2x Intel Xeon server as TF DUT1 and DUT2
- E.g. Intel® Xeon® Processor E5-2699 v4 +
- 128GB RAM
- 1TB HDD
- 10G/25G/40G Network Interface Controller on NUMA 0
1x internal switch for test network
- Support the bandwidth you want to test 10G/25G/40G
- Optional, if you want to test bonding NIC, switch should support bonding feature, like LACP mode
Software Requirements
BIOS:
- Disable Turbo boost
- Power management is set to “Performance”
- Enable C0/C1
OS: Centos7.5 Minimal
Kernel parameters for isolate cores for testing. E.g.
isolcpus=10-27,38-55,66-83,94-111 nohz_full=10-27,38-55,66-83,94-111 rcu_nocbs=10-27,38-55,66-83,94-111 irqbalance=off mce=ignore_ce intel_pstate=disable iommu=pt intel_iommu=on |
Physical Network Topology for testing
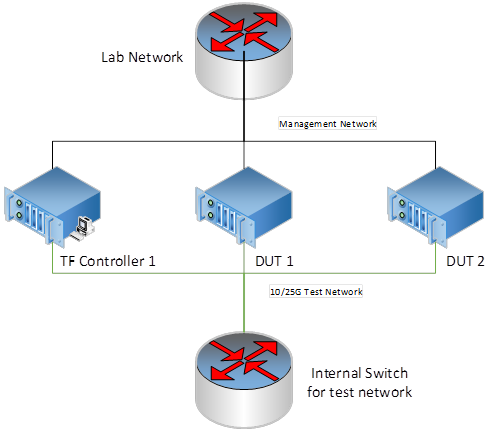
Generally, the physical topology has 2 networks, 1 network is for management and the other network is for test.
Tungsten Fabric Setup
Setup a 3-node Tungsten Fabric environment is fully automated, the playbooks are at https://github.com/Juniper/contrail-ansible-deployer. Please follow up the guide to setup the Tungsten Fabric system. We use OpenStack as the orchestration for test.
The Reference of instance.yaml for 3-node setup
# copy this file to contrail-ansible-deployer/config
provider_config: bms: ssh_pwd: tester ssh_user: root ntpserver: ntp.ubuntu.com domainsuffix: sh.intel.com
instances: bms1: provider: bms ip: 10.67.111.103 roles: openstack: config_database: config: control: analytics_database: analytics: webui: openstack_compute: vrouter: PHYSICAL_INTERFACE: ens802f0 CPU_CORE_MASK: "0xff0" DPDK_UIO_DRIVER: igb_uio HUGE_PAGES: 3000 AGENT_MODE: dpdk bms2: provider: bms ip: 10.67.111.101 roles: openstack_compute: vrouter: PHYSICAL_INTERFACE: enp24s0f0 CPU_CORE_MASK: "0xff0" DPDK_UIO_DRIVER: igb_uio HUGE_PAGES: 10240 AGENT_MODE: dpdk bms3: provider: bms ip: 10.67.111.102 roles: openstack_compute: vrouter: PHYSICAL_INTERFACE: enp24s0f0 CPU_CORE_MASK: "0xff0" DPDK_UIO_DRIVER: igb_uio HUGE_PAGES: 10240 AGENT_MODE: dpdk
contrail_configuration: CLOUD_ORCHESTRATOR: openstack CONTRAIL_VERSION: 5.0.0-0.40-ocata CONTROL_DATA_NET_LIST: 192.168.1.0/24 KEYSTONE_AUTH_HOST: 192.168.1.105 KEYSTONE_AUTH_ADMIN_PASSWORD: c0ntrail123 RABBITMQ_NODE_PORT: 5673 KEYSTONE_AUTH_URL_VERSION: /v3 IPFABRIC_SERVICE_IP: 192.168.1.105 VROUTER_GATEWAY: 192.168.1.100 HTTP_PROXY: "<if you have proxy>" HTTPS_PROXY: "<if you have proxy>" NO_PROXY: "<if you have proxy>" DPDK_UIO_DRIVER: "igb_uio"
# 10.67.111.200 should be a ip address is not used. try to ping it, before you set it kolla_config: kolla_globals: kolla_internal_vip_address: 192.168.1.105 kolla_external_vip_address: 10.67.111.200 contrail_api_interface_address: 192.168.1.103 keepalived_virtual_router_id: "235" enable_haproxy: "yes" enable_ironic: "no" enable_swift: "no" kolla_passwords: keystone_admin_password: c0ntrail123
|
After deployment successful, the topology of network and services looks like,
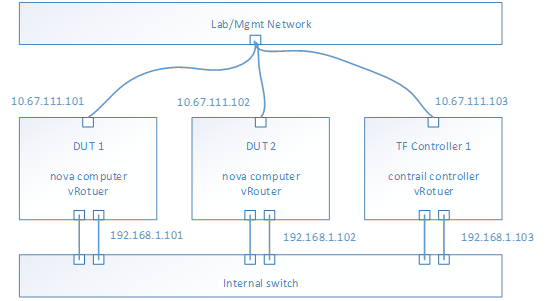
- E.g. Management Network is 10.67.111.0/24
- E.g. Test network is 192.168.1.0/24
- To check the test network by ping each IP address from each host
- Nova computer service should be running on each DUT host
- vRouter service should be running on each host
- Contrail controller services should be running on TF Controller host
- From TF 5.0, all the services are isolated into docker containers
- Use docker ps to check each service (kolla/openstack and contrail) running status
- Use contrail-status to check the contrail services healthy
- Optional, if you want to test bond driver, configure the bond device in the host OS and modify the physical interface field to bond device in instances.yaml.
Performance Test Image and Test Tools Configuration
The image for testing is based on the basic cloud image, e.g. https://cloud-images.ubuntu.com/xenial/current/xenial-server-cloudimg-amd64-disk1.img
# need to remove root pwd in the image sudo apt-get install qemu-utils sudo modprobe nbd max_part=8 wget --timestamping --tries=1 https://cloud-images.ubuntu.com/xenial/current/xenial-server-cloudimg-amd64-disk1.img sudo qemu-nbd --connect=/dev/nbd0 xenial-server-cloudimg-amd64-disk1.img sudo mount /dev/nbd0p1 /mnt/ sudo sed -i "s/root:x:/root::/" /mnt/etc/passwd sudo umount /mnt sudo qemu-nbd --disconnect /dev/nbd0 |
Configure Flavor
For performance testing, suggest to create a flavor has features
- 5 vCPU
- 6GB memory
- 20G HDD
- Metadata with hugepage enabled
- Hw:large
Configure Network/Subnetwork
For performance testing, suggest to create 4 networks, because 4 ports will be used in VPPV test. Such as,
- Test-network-1, 1.1.1.0/24
- Test-network-1, 2.2.2.0/24
- Test-network-1, 3.3.3.0/24
- Test-network-1, 4.4.4.0/24
Instances configuration
After download this basic image and do modification of the root privileges, and setup performance tools, then upload the image to OpenStack by GUI or command line.
- Use defined flavor
- Assign 4 ports from each network to the instance
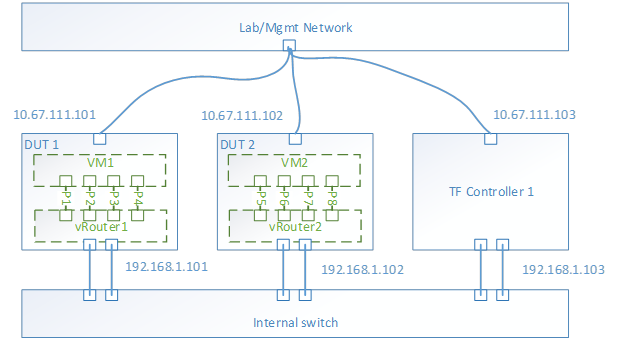
- Launch 2 instances on different host
With the instances launched, the topology look like,
Performance tool - Trex
For VPPV test, Trex is used for traffic generator. So installing the trex to the instance is mandatory. Trex installation document at https://trex-tgn.cisco.com/trex/doc/trex_manual.html#_download_and_installation. Please follow up the guide to setup the trex into /opt.
- Trex 2.41 release is tested
Performance tool - iPerf3
For the iPerf test, version 3.1.3.1 is used. Get the iPerf at https://iperf.fr/iperf-download.php
- iperf3_3.1.3-1_amd64.deb
- libiperf0_3.1.3-1_amd64.deb
Flow Table Scalability Test
Background
Flow classification and flow-table lookup take major part of the total packet processing time in vRouter. Flow classification typically involves pattern matching rules where packets need to be parsed, to form a lookup key which is then matched with the flow-table to determine the action on the flow (forward to other table, forward to an output port, drop, ..etc.). It is one of the most demanding tasks and often becomes a major performance bottleneck for packet processing using vRouter. Hence, quantifying the performance of the vRouter at different flow-table load and flow-table sizes is crucial for many workloads.
At each operating point (flow-table size, load, ..etc.) three main performance metrics for the flow-table should be quantified:
1. Lookup rate (forwarding rate), which measures the throughput of matching (either hit or miss) a flow in the flow-table and directly affects to the forwarding rate of the data plane.
2. Insert rate (update rate), which measures the throughput of inserting new keys and/or updating existing keys into the flow-table
3. Efficient table utilization, which measures how many keys in a pool of keys were inserted in the table and how many have failed to be inserted (e.g., because of too many keys collisions, ..etc.) for a given table size (i.e. allocated memory for the flow-table).
Traffic and flow table setup
As previously mention, flow-table utilization and flow count in the table affect the vRouter performance significantly. To cover a wide range of applications and workload requirements, different testing scenarios are required.
As shown in Table-1, these scenarios should cover different allocated memory for the flow-table sizes, namely, (i) Small flow-table (fits within local cache), medium (fits within last level cache) and large (doesn’t fit in cache) (in next sub-section, we give an example on how to size the flow tables for a given platform configuration). For each of these cases, the different performance metrics (lookup rate, insert rate and table utilization) should be measured at different table load, when the table is almost empty, and when it is half full, and finally when it is almost full.
Flow-Table Size | Small (fits in local CPU cache) | Medium (fits in CPU LLC cache) | Large (does not fit in cache) | ||||||
Table Load (i.e. Flow Count) | Almost empty (5% of size) | Half Full (50% of size) | Almost full (95% of size) | Almost empty (5% of size) | Half Full (50% of size) | Almost full (95% of size) | Almost empty (5% of size) | Half Full (50% of size) | Almost full (95% of size) |
Flow-table Metrics | Lookup Rate, Insert Rate and Table Utilization | Lookup Rate, Insert Rate and Table Utilization | Lookup Rate, Insert Rate and Table Utilization | ||||||
Table 1: Flow-table Scalability Testing Scenarios
Flow-table Scaling Sizing Example
As a reference we give an example on flow-table sizing for a given platform configuration. For example, for the following Skylake platform configuration:
- 1st Level Cache (L1) is 32KB (equivalent to 512 cache line), 2nd Level Cache (L2) is 1MB (equivalent to 16K cache line) and Last Level Cache (LLC) is 322MB (equivalent to 512K cache lines)
- If we assume an IPv4/IPv6 vRouter flow-table, then the entry size is aligned to 2 cache lines
- A small-sized flow-table should be initialized to hold a maximum of 8K entries to fit in local cache (L2). A medium-sized flow-table should be initialized to hold a maximum of 256K entries to fit in Last Level Cache (LLC). A large-sized flow-table should be initialized to hold significantly more than 256K entries to test the case when the table doesn’t fit in cache, hence, a table initialized for 1M entries covers this case.
- For each table size, the table load (i.e. the number of used entries out of total available) will reflect one test case. For example, for a medium sized table of 256K entries, the performance metrics (i.e. lookup rate, insert rate and table utilization) are measured for the case when user inserts 12K entries for the case of an almost-empty flow table, and 128K entries for the half-full case, and 230K entries for the almost-full case. Table -2 summarizes these 9 testing scenarios for the example platform.