...
After deployment successful, the topology of network and services looks like,
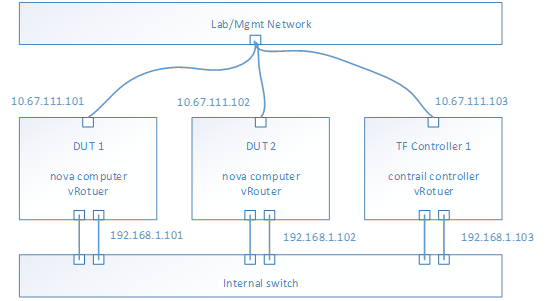
- E.g. Management Network is 10.67.111.0/24
- E.g. Test network is 192.168.1.0/24
- To check the test network by ping each IP address from each host
- Nova computer service should be running on each DUT host
- vRouter service should be running on each host
- Contrail controller services should be running on TF Controller host
- From TF 5.0, all the services are isolated into docker containers
- Use docker ps to check each service (kolla/openstack and contrail) running status
- Use contrail-status to check the contrail services healthy
- Optional, if you want to test bond driver, configure the bond device in the host OS and modify the physical interface field to bond device in instances.yaml.
...
- Test-network-1, 1.1.1.0/24
- Test-network-1, 2.2.2.0/24
- Test-network-1, 3.3.3.0/24
- Test-network-1, 4.4.4.0/24
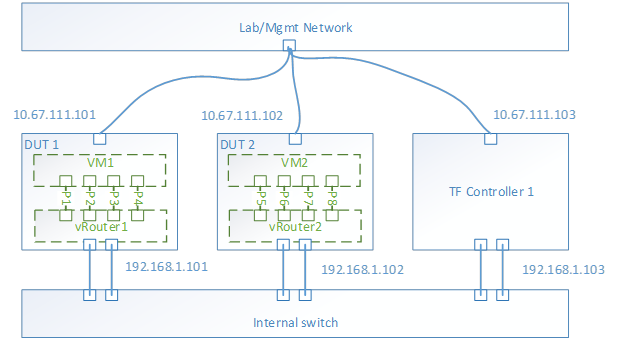
Instances configuration
After download this basic image and do modification of the root privileges, and setup performance tools, then upload the image to OpenStack by GUI or command line.
- Use defined flavor
- Assign 4 ports from each network to the instance
- Launch 2 instances on different host
With the instances launched, the topology look like,
Performance tool - Trex
For VPPV test, Trex is used for traffic generator. So installing the trex to the instance is mandatory. Trex installation document at https://trex-tgn.cisco.com/trex/doc/trex_manual.html#_download_and_installation. Please follow up the guide to setup the trex into /opt.
- Trex 2.41 release is tested
Performance tool - iPerf3
For the iPerf test, version 3.1.3.1 is used. Get the iPerf at https://iperf.fr/iperf-download.php
- iperf3_3.1.3-1_amd64.deb
- libiperf0_3.1.3-1_amd64.deb
Flow Table Scalability Test
Background
Flow classification and flow-table lookup take major part of the total packet processing time in vRouter. Flow classification typically involves pattern matching rules where packets need to be parsed, to form a lookup key which is then matched with the flow-table to determine the action on the flow (forward to other table, forward to an output port, drop, ..etc.). It is one of the most demanding tasks and often becomes a major performance bottleneck for packet processing using vRouter. Hence, quantifying the performance of the vRouter at different flow-table load and flow-table sizes is crucial for many workloads.
At each operating point (flow-table size, load, ..etc.) three main performance metrics for the flow-table should be quantified:
1. Lookup rate (forwarding rate), which measures the throughput of matching (either hit or miss) a flow in the flow-table and directly affects to the forwarding rate of the data plane.
2. Insert rate (update rate), which measures the throughput of inserting new keys and/or updating existing keys into the flow-table
3. Efficient table utilization, which measures how many keys in a pool of keys were inserted in the table and how many have failed to be inserted (e.g., because of too many keys collisions, ..etc.) for a given table size (i.e. allocated memory for the flow-table).
Traffic and flow table setup
As previously mention, flow-table utilization and flow count in the table affect the vRouter performance significantly. To cover a wide range of applications and workload requirements, different testing scenarios are required.
As shown in Table-1, these scenarios should cover different allocated memory for the flow-table sizes, namely, (i) Small flow-table (fits within local cache), medium (fits within last level cache) and large (doesn’t fit in cache) (in next sub-section, we give an example on how to size the flow tables for a given platform configuration). For each of these cases, the different performance metrics (lookup rate, insert rate and table utilization) should be measured at different table load, when the table is almost empty, and when it is half full, and finally when it is almost full.
Flow-Table Size | Small (fits in local CPU cache) | Medium (fits in CPU LLC cache) | Large (does not fit in cache) | ||||||
Table Load (i.e. Flow Count) | Almost empty (5% of size) | Half Full (50% of size) | Almost full (95% of size) | Almost empty (5% of size) | Half Full (50% of size) | Almost full (95% of size) | Almost empty (5% of size) | Half Full (50% of size) | Almost full (95% of size) |
Flow-table Metrics | Lookup Rate, Insert Rate and Table Utilization | Lookup Rate, Insert Rate and Table Utilization | Lookup Rate, Insert Rate and Table Utilization | ||||||
Table 1: Flow-table Scalability Testing Scenarios